
"Incumbent candidates and parties keen to win reelection seek to make voters feel financially secure when heading to the polls. Parties in office will, therefore, attempt to stimulate growth as much as possible through fiscal spending and possibly even monetary policy. Historically, this stimulation can be positive for both cyclical and small-cap stocks."
Insights
Election Cycle is Very Likely to Impact Stocks
Featured

All Articles ()
There are currently no articles for this filter
KEY POINTS
1. During presidential election years over most of the last century, on average both U.S. large- and small-cap value have outperformed their growth peers.
2. Value vs. Growth's dominance in election years also correlates with U.S. gross domestic product (GDP) growth and detraction.
3. Incumbent candidates and parties keen to win reelection seek to make voters feel financially secure when heading to the polls.
As two thirds of global voters in democratically-elected governments go to the polls in 2024, politics are top of mind and will almost certainly impact the stock market this year. Kicking off the year, there is a major bifurcation in the market that leans heavily on general skepticism for global growth.
To set the stage, we look back at the last century of U.S. presidential elections and highlight a few notable statistics about historical markets during election years:
- On average, during presidential election years, both U.S. large and small-cap value outperform their growth peers1 - in fact, large cap-value outperformed large-cap growth in 17 of the past 23 election years, dating back to 1932.
- Zooming in on presidential elections between 1944 and 2020, U.S. gross domestic product (GDP) contracted in two of the last three quarters of the five of the six election years that value did not outperform.
Growth vs. Value Performance During Election Years
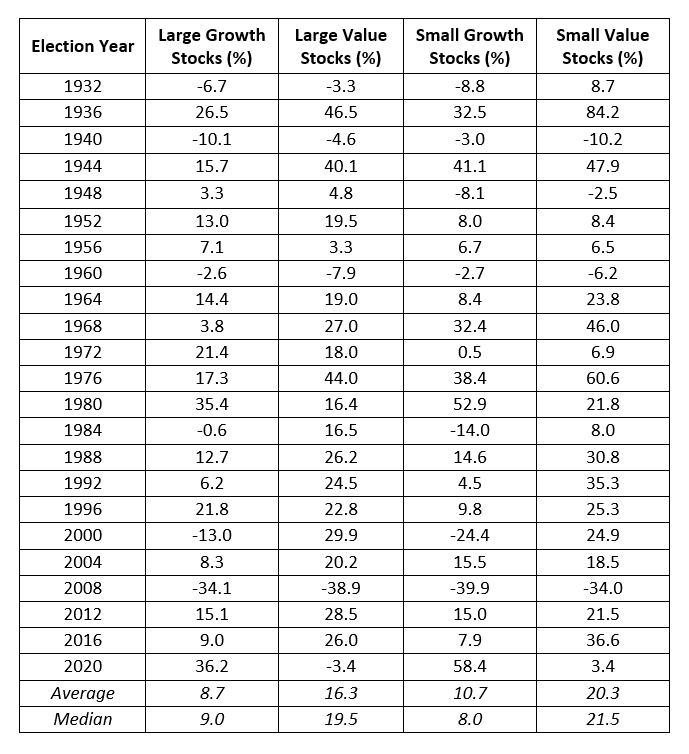
Source: Strategas, Fama-French Growth & Value Series
In 13 of the above elections, an incumbent candidate was running for reelection. Large value stocks underperformed large growth stocks only in 1972 and 1980 during those 13 years.
Economic growth is very important in the election cycle. Incumbent candidates and parties keen to win reelection seek to make voters feel financially secure when heading to the polls. Parties in office will, therefore, attempt to stimulate growth as much as possible through fiscal spending and possibly even monetary policy. Historically, this stimulation can be positive for both cyclical and small-cap stocks.
This phenomenon could be impactful for the market in a year such as 2024, potentially driving a broadening of the equity market beyond mega-cap companies. In our view, we are now back to prior extreme peaks in valuation for some of these companies and excessive narrowness in the market. Elsewhere, while there was multiple expansion during 2023, cyclicals sectors (such as consumer discretion, energy, basic materials and financials) lacked notable momentum.
At An Extreme: Nasdaq 100 Stock Index & Bloomberg Commodity Spot Index
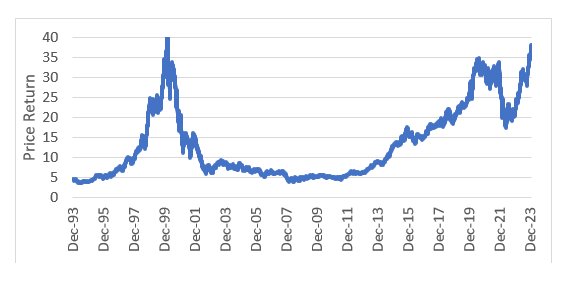
Source: Bloomberg, as of February 12, 2024. The Nasdaq 100 has traded so strongly over the last year (and vice versa for the Commodity Index), and they are at an extreme valuation difference due to narrowness/stretched valuations in growth currently in the market.
While history does not always repeat itself, it typically has some valuable lessons. As we have written in a previous blog about how the Magnificent Seven2 have indeed lived up to their name, we believe much of this is due to recency bias and hopes for the future potential of artificial intelligence (AI). With the Magnificent Seven now at stretched valuations, and given the history of election years and spending, a balanced allocation likely makes sense.
We do not believe a rising tide will potentially lift all boats here. As earnings revisions fall into place, selectivity and having a well-defined thesis is essential. Our Opportunistic Value investment philosophy focuses on quality, leading companies that are mispriced or misunderstood by the market and are trading at a discount to their intrinsic value.
Bottom Line: We believe 2024 has several unique components to it, including a U.S. presidential election and the Federal Reserve's continued balancing act between maintaining inflation and growing the economy. Active management becomes more essential in an environment with many different drivers at play, in navigating and finding true potential opportunities in this unprecedented environment.
1 "Growth" and "Value" defined by Fama French, which uses attributes that define both elements, rather than index provider definitions. Fama and French Three-Factor Model (or Fama French Model for short) is an asset pricing model developed in 1992 that expands on the capital asset pricing model (CAPM) by adding size risk and value risk factors to the market risk factor in CAPM.
2 Magnificent Seven refers to Alphabet, Amazon, Apple, Meta Platforms, Microsoft, Nvidia, and Tesla.
